Sunday, March 20, 2011

Chapter 9: The Changing South

http://labor.alaska.gov/research/occtbl/pdfs/farm.pdf


The creation of the Marine Division has strengthened the presence of ILWU in Alaska through coordination and cooperation between the IBU shoreside and maritime members, the Region 37 cannery workers, and ILWU Local 200’s longshore, health care, cold storage and general industry members.
ILWU organizing in Alaska has always been difficult: distances between cities and work sites, an ever-changing workforce, shifting patterns of seasonal employment, and raids by other unions have challenged ILWU leaders and rank and filers since the first organizing efforts of the1930s.
As a result, ILWU organization has sometimes been erratic, and the ability to service outlying units has sometimes fallen short of expectations. Since the 1970s, however, a new generation of workers – responding to a transformation of the state’s economy – has grappled with these problems and has developed a new and more effective structure for the ILWU in Alaska. The realignment of the ILWU in Alaska took place as the result of new growth after 1975, beginning with new organizing among seafood processing workers. Unity was given a boost in 1981, when all Alaska longshore locals were finally working under one agreement – covering both ILWU and IBU shoreside workers.


Then, 1983, members of the all ILWU fish and longshore locals – which had since 1978 functioned as 16 small and separate members of the ILWU’s Alaska Council – voted to consolidate their administration and resources into one new unit: Local 200. In 1985, Local 200’s occupational jurisdiction in Alaska took on a new look when nursing, professional service, and administrative employees at Bartlett Memorial Hospital in Juneau signed up with the union.

The addition of the Bartlett unit helped invigorate the local, and in 1986 led to the first Alaska area convention called to discuss strategic planning and possible restructuring. The convention decided to re-organize the Local into regional units with industrial divisions: longshore, health care, cold storage, and public service workers. This new, coordinated approach to ILWU organization in Alaska helped the units in the 1990s to meet a serious threat to ILWU jurisdiction from a new direction: the giant factory ships of foreign fishing fleets


A loophole in the 1990 Immigration Act was being interpreted by foreign shipowners as license to haveseamen on foreign-flag vessels do longshore work aboard their ships when they were in U.S. ports. This loophole frequently was being used by large Japanese fish trawlers operating in U.S. coastal waters— mainly Alaska – to bypass ILWU longshore labor in the transfer of their catch to shoreside facilities or other ships.


In 1995 after a two-year battle in Washington, D.C., with the Immigration and Naturalization Service and the Department of Labor, the ILWU won adoption of the "Alaska Exception," which closed the loophole. ILWU longshore workers in Alaska are now assured of having first opportunity to work aboard the foreign fish trawlers.


Saturday, March 19, 2011

Chapter 8: Appalachia And The Ozarks

Mining
Alaska often conjures up images of gold - prospectors, miners and adventurers combing the creeks of the Interior searching for the next big discovery. The town of Fairbanks, and many of its surrounding communities, among them Ester, Fox and Chatanika, were founded because of placer gold discoveries on local creeks in the early 1900's. However, the communities that survived into this century survived because their economies diversified away from gold production; others - such as Meehan and Cleary - withered and died when the miners pulled out.

Alaska's Mineral Wealth


Gold and the stampedes it caused were critical factors in the European settlement of Alaska. Therefore, gold is the metal most often associated with this state's mineral resources.


However, Alaskan geology also hosts some of the world's largest and richest deposits of lead, zinc, silver and copper. Kennecott - one of the world's largest mining companies, got its start here with the Kennecott Copper mine (now a National Park) in the Wrangell Mountains, which mined one of the richest copper deposits ever found. And Teck-Cominco's Red Dog mine, located in the DeLong Mountains 50 miles northeast of the Native Village of Kivalina, currently holds the position as the world's largest lead-zinc mine. Platinum has also been mined here, and there are ongoing searches for the diamonds and sapphires that many prospectors are convinced lie undetected in stream gravels. 


Modern Metal Mining in Alaska

Fort Knox Mine
Overview of Fort Knox Mine looking south by southeast. The open pit gold mine is seen in the background, with the low-grade ore stockpile and conveyor in the foreground. Photo provided by Fairbanks Gold Mining Co.


http://www.northern.org/artman/publish/mining.shtml


Chapter 7: The Bypassed East

Near Little Port Walter in Southeast Alaska.


Population distribution

Anchorage.jpg
Anchorage is the largest city in Alaska.
Alaska is the least densely populated state in the U.S. with 0.4247 people per square kilometer (1.1 per square mile). Population densities in the other states range from 1.97 per square kilometer (5.1 per square mile) in Wyoming to 438 per square kilometer (1,134.4 per square mile) in New Jersey. Alaska's population was estimated to be 663,661 in 2005.
Alaska's most populous city is Anchorage, home to 277,000 people (2007 estimate)—42 percent of the state's population. The city comprises 5,063 sq. kilometers (1,955 sq. miles)—about the size of the land area of the state of Delaware.
In 2007, Alaska had more than three times the people and five times the jobs it had when it became a state in 1959. More than 60 percent of the population lives in Anchorage and adjacent boroughs. Many of the Alaska natives continue to live in remote villages scattered throughout the state, generally along rivers or the coasts. The lifestyles of those in the cities and those in rural areas are vastly different. Many in the remote areas survive on subsistence farming and fishing and must contend with a lack of safe water and sewer systems. Unemployment in these areas tends to be quite high.
The vast, sparsely populated regions of northern and western Alaska are primarily inhabited by Alaska Natives, who are also numerous in the southeast. Anchorage, Fairbanks, and other parts of south-central and southeast Alaska have many whites of northern and Western European ancestry. The Wrangell-Petersburg area has many residents of Scandinavian ancestry and the Aleutians contain a large Filipino population. Most of the state's black population lives in Anchorage. Fairbanks also has a sizable African American population.

Agriculture and manufacturing

Agriculture represents only a small fraction of the Alaska economy. Agricultural production is primarily for consumption within the state and includes nursery stock, dairy products, vegetables, and livestock. Manufacturing is limited, with most foodstuffs and general goods imported from elsewhere.
Environmentalism
Oil production was not the only economic value of Alaska's land, however. In the second half of the twentieth century, Alaska discovered tourism as an important source of revenue, which had become popular following World War II, when men stationed in the region returned home praising its natural splendor. The Alcan Highway, built during the war, and the Alaska Marine Highway System, completed in 1963, made the state more accessible than it had ever been. Tourism became increasingly important in Alaska, and today over 1.4 million people visit the state each year.
With tourism more vital to the economy, environmentalism also rose in importance. The Alaska National Interest Lands Conservation Act (ANILCA) of 1980 added 53.7 million acres (217,000 km²) to the National Wildlife Refuge system, parts of 25 rivers to the National Wild and Scenic Rivers system, 3.3 million acres (13,000 sq km) to National Forest lands, and 43.6 million acres (176,000 sq km) to National Park land. Because of the Act, Alaska now contains two-thirds of all American national park lands. Today, more than half of Alaskan land is owned by the Federal Government.
Exxon-Valdez
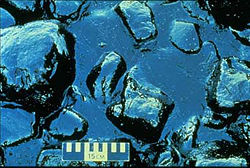
Oil pooled on rocks on the shore of Prince William Sound after the oil spill.
The possible environmental repercussions of oil production became clear in the Exxon Valdez oil spill of 1989. On March 24, the tanker Exxon Valdez ran aground in Prince William Sound, releasing 11 million gallons (42 million liters) of crude oil into the water, spreading along 1,100 miles (1,800 km) of shoreline. According to the U.S. Fish and Wildlife Service, at least 300,000 sea birds, 2,000 otters, and other marine animals died as a result of the spill. Exxon spent $2 billion on cleaning up in the first year alone. Exxon, working with state and federal agencies, continued its cleanup into the early 1990s. Government studies show that the oil and the cleaning process itself did long-term harm to the ecology of the Sound, interfering with the reproduction of birds and animals in ways that still aren't fully understood. Prince William Sound seems to have recuperated, but scientists still dispute the extent of the recovery. In a civil settlement, Exxon agreed to pay $900 million in ten annual payments, plus an additional $100 million for newly discovered damages.
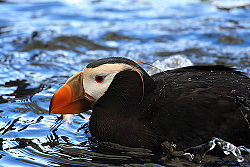
Tufted Puffin at the Alaska SeaLife Center.
The Alaska SeaLife Center, which opened in May 1998, was established by The Seward Association for Advancement of Marine Science and continues as a collaborative effort between Coastal America, North Pacific Research Board, University of Alaska School of Fisheries and Ocean Sciences, and Ocean Alaska Science & Learning Center.
The Exxon Valdez Oil Spill Settlement Fund provided $26 million to help build the $56 million facility. Grants, bonds and donations supplied the remaining funds, while the city of Seward donated a seven-acre waterfront site.
The center is dedicated to understanding and maintaining the integrity of the marine ecosystem of Alaska through research, rehabilitation, and public education. Visitors are immersed in naturalistic exhibits relating to the marine ecosystems of the state.
Arctic National Wildlife Refuge
Today, the tension between preservation and development is seen in the Arctic National Wildlife Refuge (ANWR) drilling controversy. The question of whether to allow drilling for oil in ANWR has been a political football for every sitting American president since Jimmy Carter. Studies performed by the U.S. Geological Survey have shown that the "1002 area" of ANWR, located just east of Prudhoe Bay, contains large deposits of crude oil.
Traditionally, Alaskan residents, trade unions, and business interests have supported drilling in the refuge, while environmental groups and many within the U.S. Democratic Party have traditionally opposed it. Among native Alaskan tribes, support is mixed. In the 1990s and 2000s, votes about the status of the refuge occurred repeatedly in the U.S. House and Senate, but as of 2007, efforts to allow drilling have always been ultimately thwarted by filibusters, amendments, or vetoes.

http://www.newworldencyclopedia.org/entry/Alaska#Agriculture_and_manufacturing

Chapter 5: The North American Manufacturing Core


Agriculture

here are only about 500 farms in Alaska, most clustered in the 880,000 acre Matanuska Valley northeast of Anchorage.

n terms of revenue generated, Alaska's top five agricultural products are greenhouse and nursery products, hay, dairy products, potatoes, and cattle and calves.

Livestock

he most valuable livestock commodity produced in Alaska is milk, followed by eggs and beef cattle. Alaskan farmers also raise chickens, hogs, sheep, and lambs. Native Alaskan Inuit maintain herds of reindeer as a source of meat and hides.

Crops

reenhouse and nursery products are the top agricultural revenue producers in Alaska.

arley, hay, oats, and potatoes are prevalent field crops.

imber, spread over 25 million acres, is also important to the state.


Manufacturing

Food processing (fish products) is Alaska's leading manufacturing activity, in terms of value added by manufacture. Ketchikan, on Kodiak Island, is considered the center of the world's salmon-packing industry.

petroleum products rank second.
Mining

il provides about 95 percent of Alaska's mining income. Other mined products are gold, zinc, silver, coal, crushed stone, lead, molybdenum, and sand and gravel.
Fishing

laska's fish catch is the most valuable among the 50 states. The most important commercial fishing ports are at Kodiak and Unalaska/Dutch Harbor.

arge catches of cod, flounder, pollock, rockfish, sablefish, salmon, and smelt drive the industry.

ungeness crab, king crab, scallops, sea urchins, shrimp, snow crab, and herring eggs are other important products of the fleet.
Services

overnment services, public schools, public hospitals and military bases. Tourism is a major sector of Alaska's economy attracting over one million visitors annually.


Sources


"Alaska." Encyclopedia Britannica. 2007. Encyclopedia Britannica Online. 1 May 2007 <http://www.britannica.com/eb/article-9111277>.


Alaska is very rich in natural resources. Lakes, forests, fish, game animal and also soil are all natural resources found in Alaska. There are also below ground natural resources found in Alaska. There is gold, oil and cranium. There is also coal silver and copper. Some other ones are natural gasses, uranium, tungsten and finally jade.
Alaska grows and raises many things. Potatoes, oats, hay, cabbage, barley and many other things are all things that Alaska grows. Alaska raises many things such as chickens, hogs, cows, dairy cows and sheep.
 manufacturing accounts for 3 percent of the growth of the state! Fish products are one of the major manufactured goods in the state. Almost any where you go you can buy fish products. Furs are important, too. Paper, lumber, wood, cement blocks and concrete blocks are all things that Alaska manufactures.


Click here for manufacturing fact  about Alaska:


Chapter 4: Megalopolis

As of the 2005-2007 American Community Survey conducted by the U.S. Census Bureau, White Americans made up 68.5% of Alaska's population. African Americans made up 3.8% of Alaska's population. American Indians and Alaska Natives made up 13.4% of Alaska's population; they are the largest minority groupAsian Americans made up 4.6% of Alaska's population. Pacific Islander Americans made up 0.5% of the state's population. Individuals from some other race made up 1.9% of Alaska's population while individuals from two or more races made up 7.2% of the state's population. Hispanics and Latinos made up 5.5% of Alaska's population.[4]


For European ancestry, German Americans are the largest single ethnic group in Alaska; they made up 19.3% of Alaska's population and they are the only ethnic group in the state with over 100,000 members. Irish Americans made up 12.5% of Alaska's population while English Americans made up 10.8% of the state's population. Norwegian Americans made up 4.2% of Alaska's population and French Americans made up 3.6% of the state's population.[5]

The vast and sparsely populated regions of northern and western Alaska are primarily inhabited by Alaska Natives, who are also numerous in the southeast. Anchorage, Fairbanks, and other parts of south-central and southeast Alaska have many White Americans of northern andwestern European ancestry. The Wrangell-Petersburg area has many residents of Scandinavian ancestry and the Aleutian Islands contain a large Filipino population. The vast majority of the state's African American population lives in Anchorage and Fairbanks. Also, Alaska has the largest percentage of American Indians of any state.

Demographics of Alaska (csv)
By raceWhiteBlackAIAN*AsianNHPI*
2000 (total population)75.43%4.46%19.06%5.24%0.88%
2000 (Hispanic only)3.42%0.33%0.45%0.16%0.06%
2005 (total population)74.71%4.72%18.77%5.90%0.88%
2005 (Hispanic only)4.32%0.38%0.48%0.19%0.05%
Growth 2000–05 (total population)4.85%12.03%4.27%19.23%5.35%
Growth 2000–05 (non-Hispanic only)3.49%11.30%4.02%18.96%5.86%
Growth 2000–05 (Hispanic only)33.56%21.02%14.52%27.89%-1.95%
* AIAN is American Indian or Alaskan Native; NHPI is Native Hawaiian or Pacific Islander


Alaska Population Density Map
Historical populations
CensusPop.
188033,426
189032,052−4.1%
190063,59298.4%
191064,3561.2%
192055,036−14.5%
193059,2787.7%
194072,52422.3%
1950128,64377.4%
1960226,16775.8%
1970300,38232.8%
1980401,85133.8%
1990550,04336.9%
2000626,93214.0%
2010710,23113.3%
1930 and 1940 censuses taken in preceding autumn
Sources: 1910-2010[1]


http://en.wikipedia.org/wiki/Demographics_of_Alaska


Population of Alaska
By Census Bureau
Mar 28, 2006

Alaska

   Business QuickFactsAlaskaUSA
Private nonfarm establishments definition and source infoPrivate nonfarm establishments, 200819,93417,601,169
Private nonfarm employment definition and source infoPrivate nonfarm employment, 2008248,3871120,903,551
Private nonfarm employment definition and source infoPrivate nonfarm employment, percent change 2000-200821.2%16.0%
Nonemployer establishments definition and source infoNonemployer establishments, 200852,21921,351,320
Total number of firms definition and source infoTotal number of firms, 200262,14522,974,655
Black-owned firms, percent definition and source infoBlack-owned firms, percent, 20021.5%5.2%
American Indian and Alaska Native owned firms, percent definition and source infoAmerican Indian and Alaska Native owned firms, percent, 20028.3%0.9%
Asian-owned firms, percent definition and source infoAsian-owned firms, percent, 20023.1%4.8%
Native Hawaiian and Other Pacific Islander owned firms, percent definition and source infoNative Hawaiian and Other Pacific Islander owned firms, percent, 20020.2%0.1%
Hispanic-owned firms, percent definition and source infoHispanic-owned firms, percent, 20022.0%6.8%
Women-owned firms, percent definition and source infoWomen-owned firms, percent, 200226.2%28.2%
 
Manufacturers shipments definition and source infoManufacturers shipments, 2002 ($1000)3,832,0243,916,136,712
Wholesale trade sales definition and source infoWholesale trade sales, 2002 ($1000)3,616,6744,634,755,112
Retail sales definition and source infoRetail sales, 2002 ($1000)7,437,0713,056,421,997
Retail sales per capita definition and source infoRetail sales per capita, 2002$11,605$10,615
Accommodation and foodservices sales definition and source infoAccommodation and foodservices sales, 2002 ($1000)1,393,225449,498,718
Building permits definition and source infoBuilding permits, 20099161582,963
Federal spending definition and source infoFederal spending, 20089,422,70912,771,782,1522
   People QuickFactsAlaskaUSA
Population definition and source infoPopulation, 2009 estimate698,473307,006,550
Population, percent change, April 1, 2000 to July 1 definition and source infoPopulation, percent change, April 1, 2000 to July 1, 200911.4%9.1%
 definition and source infoPopulation estimates base (April 1) 2000626,931281,424,602
Persons under 5 years old, percent definition and source infoPersons under 5 years old, percent, 20097.8%6.9%
Persons under 18 years old, percent definition and source infoPersons under 18 years old, percent, 200926.3%24.3%
Persons 65 years old and over, percent definition and source infoPersons 65 years old and over, percent, 20097.6%12.9%
Female persons, percent definition and source infoFemale persons, percent, 200948.1%50.7%
 
White persons, percent definition and source infoWhite persons, percent, 2009 (a)70.3%79.6%
Black persons, percent definition and source infoBlack persons, percent, 2009 (a)4.2%12.9%
American Indian and Alaska Native persons, percent definition and source infoAmerican Indian and Alaska Native persons, percent, 2009 (a)15.2%1.0%
Asian persons, percent definition and source infoAsian persons, percent, 2009 (a)5.0%4.6%
Native Hawaiian and Other Pacific Islander, percent definition and source infoNative Hawaiian and Other Pacific Islander, percent, 2009 (a)0.7%0.2%
Persons reporting two or more races, percent definition and source infoPersons reporting two or more races, percent, 20094.7%1.7%
Persons of Hispanic or Latino origin, percent definition and source infoPersons of Hispanic or Latino origin, percent, 2009 (b)6.4%15.8%
White persons not Hispanic, percent definition and source infoWhite persons not Hispanic, percent, 200965.2%65.1%
 
Living in same house in 1995 and 2000 definition and source infoLiving in same house in 1995 and 2000, pct 5 yrs old & over46.2%54.1%
Foreign born persons, percent definition and source infoForeign born persons, percent, 20005.9%11.1%
Language other than English spoken at home, pct age 5+ definition and source infoLanguage other than English spoken at home, pct age 5+, 200014.3%17.9%
High school graduates, percent of persons age 25+ definition and source infoHigh school graduates, percent of persons age 25+, 200088.3%80.4%
Bachelor's degree or higher, pct of persons age 25+ definition and source infoBachelor's degree or higher, pct of persons age 25+, 200024.7%24.4%
Persons with a disability, age 5+ definition and source infoPersons with a disability, age 5+, 200083,22049,746,248
Mean travel time to work (minutes), workers age 16+ definition and source infoMean travel time to work (minutes), workers age 16+, 200019.625.5
 
Housing units definition and source infoHousing units, 2009283,878129,969,653
Homeownership rate definition and source infoHomeownership rate, 200062.5%66.2%
Housing units in multi-unit structures, percent definition and source infoHousing units in multi-unit structures, percent, 200027.0%26.4%
Median value of owner-occupied housing units definition and source infoMedian value of owner-occupied housing units, 2000$144,200$119,600
 
Households definition and source infoHouseholds, 2000221,600105,480,101
Persons per household definition and source infoPersons per household, 20002.742.59
Median household income definition and source infoMedian household income, 2008$67,332$52,029
Per capita money income definition and source infoPer capita money income, 1999$22,660$21,587
Persons below poverty level, percent definition and source infoPersons below poverty level, percent, 20089.2%13.2%
   Geography QuickFactsAlaskaUSA
Land area definition and source infoLand area, 2000 (square miles)571,951.263,537,438.44
Persons per square mile definition and source infoPersons per square mile, 20001.179.6
 definition and source infoFIPS Code02


http://quickfacts.census.gov/qfd/states/02000.html